Google Analytics 4 (GA4) is a crucial tool used for tracking and analyzing the behavior of visitors to your website, aiming to optimize your e-commerce platform. Therefore, as a professional marketer in today’s data-rich era, understanding the underlying data structure and origin of GA4 can significantly aid in dissecting the operational status of your e-commerce business. This knowledge empowers you to make more informed decisions based on the utilization of this data.
This article will guide you through the architecture of GA4 raw data and explore the practical application of raw parameters in tracking consumer behavior for both “e-commerce” and “brand” perspectives. After understanding these parameters, we’ll delve into how to effectively apply them on a brand’s official website or e-commerce platform.
Outline of the Article
- What constitutes the raw data of GA4? How can GA4 reports be compared?
- How to practically utilize GA4 raw data on an e-commerce platform?
- How to practically utilize GA4 raw data on a brand’s official website?
What constitutes the raw data of GA4? How to compare GA4 reports?
Apart from gender and age, GA4, when integrated with BigQuery, permanently preserves data in its raw form. The following will list several commonly used GA4 raw data items and their corresponding data in GA4 reports:
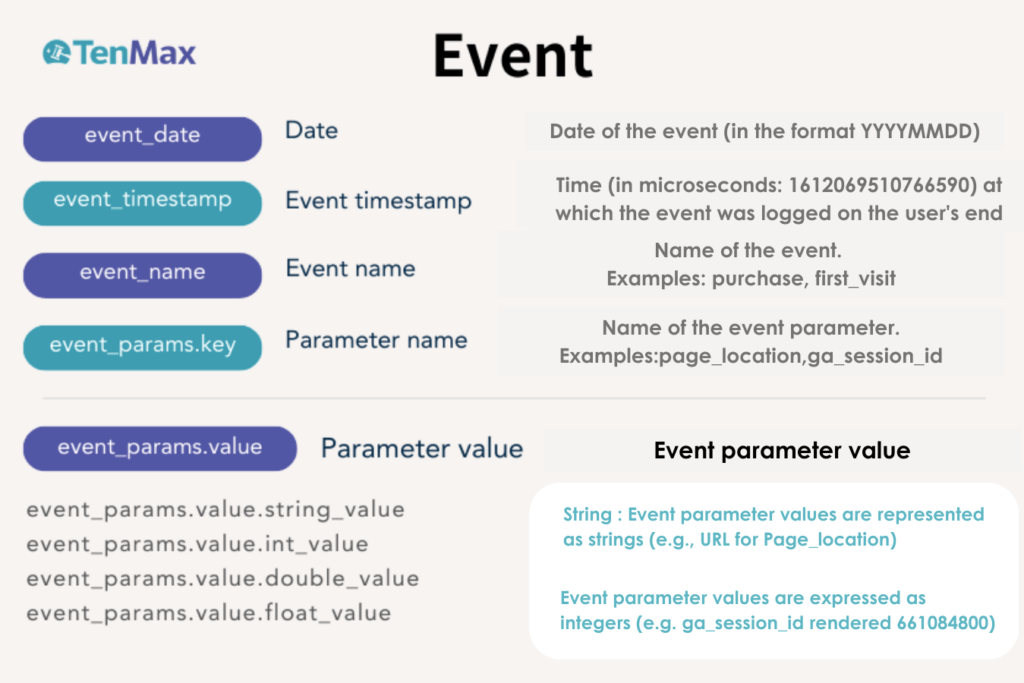
- Event Data:
- event_name:The name of the event, such as purchase or first_visit, is included.
- event_params.key:The name of the event parameter, such as page_location or ga_session_id, is included.
- event_params.value:The value of the event parameter; for example, ga_session_id may be represented as 661084800.
2. Traffic Data:
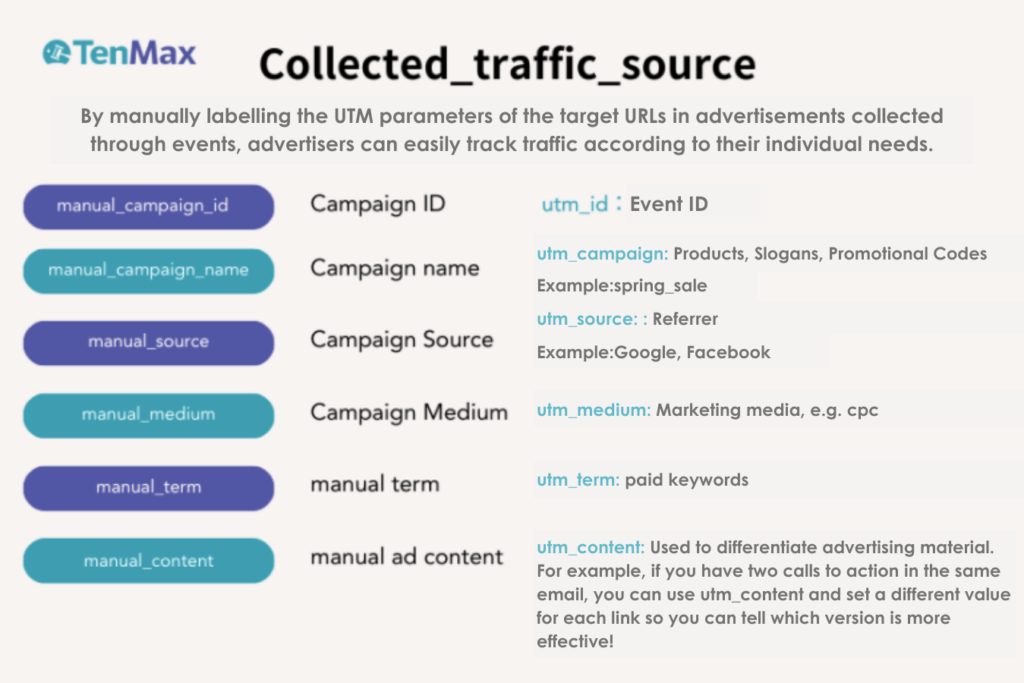
- collected_traffic_source:Manually marked utm parameters in the target URL within advertisements, collected through events. This facilitates advertisers in tracking traffic based on individual needs. Items include, but are not limited to, manual_source, manual_campaign_name (campaign name), manual_medium, etc
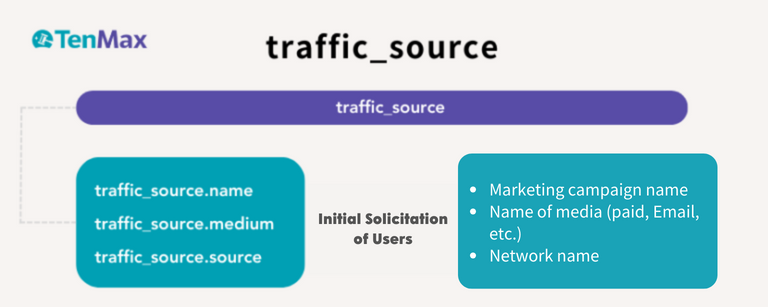
- traffic_source:is used to understand the channels through which users were initially acquired. It includes traffic_source.name, traffic_source.medium, and traffic_source.source to provide insights into the methods through which users were first attracted.
3. User Data:
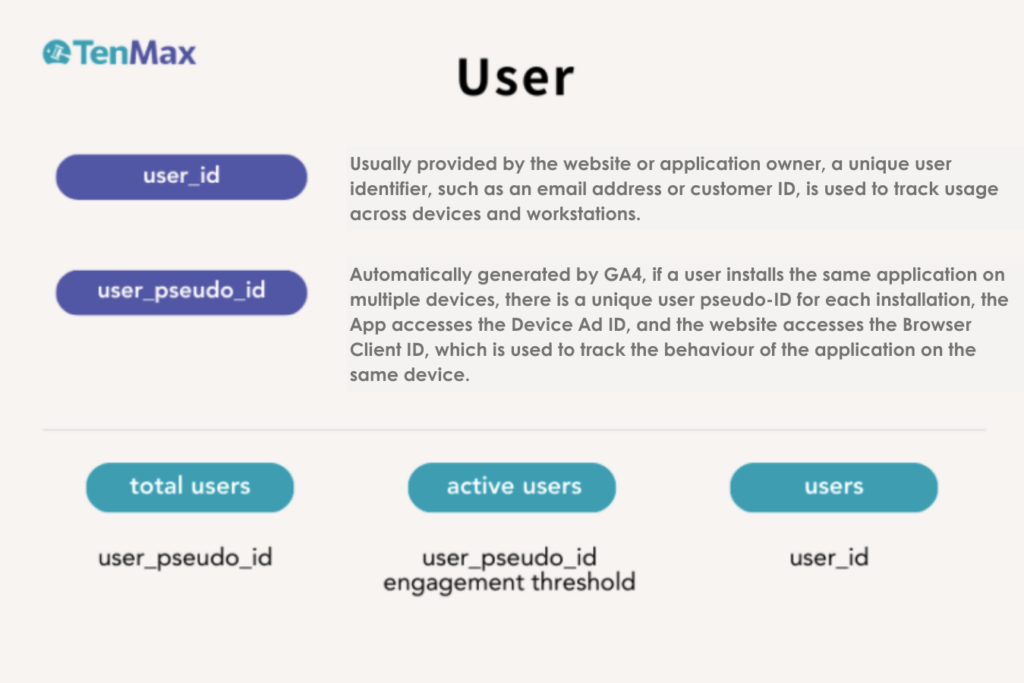
- user_id: A unique identifier representing the user, such as an email address or customer ID. It is used for cross-device and cross-session tracking.
- user_pseudo_id: User pseudo ID, where mobile apps access the device’s advertising ID, and websites access the browser’s Client ID. This is utilized to track behavior within the same device application.
When utilizing GA4, it’s important to note that active users for GA4 are calculated using user_pseudo_id and metrics related to interactions, not using user_id.
How to practically utilize GA4 raw data on an e-commerce platform?
For an e-commerce platform, which GA4 raw data fields are used to observe the entire consumer shopping journey? If a business owner wants to understand the overall e-commerce situation, including consumer sources, devices used, and top-selling products, what data fields would be utilized? The following will provide explanations for each aspect.
Consumer Journey:
Break down the consumer’s shopping journey on the e-commerce website into four stages for explanation.
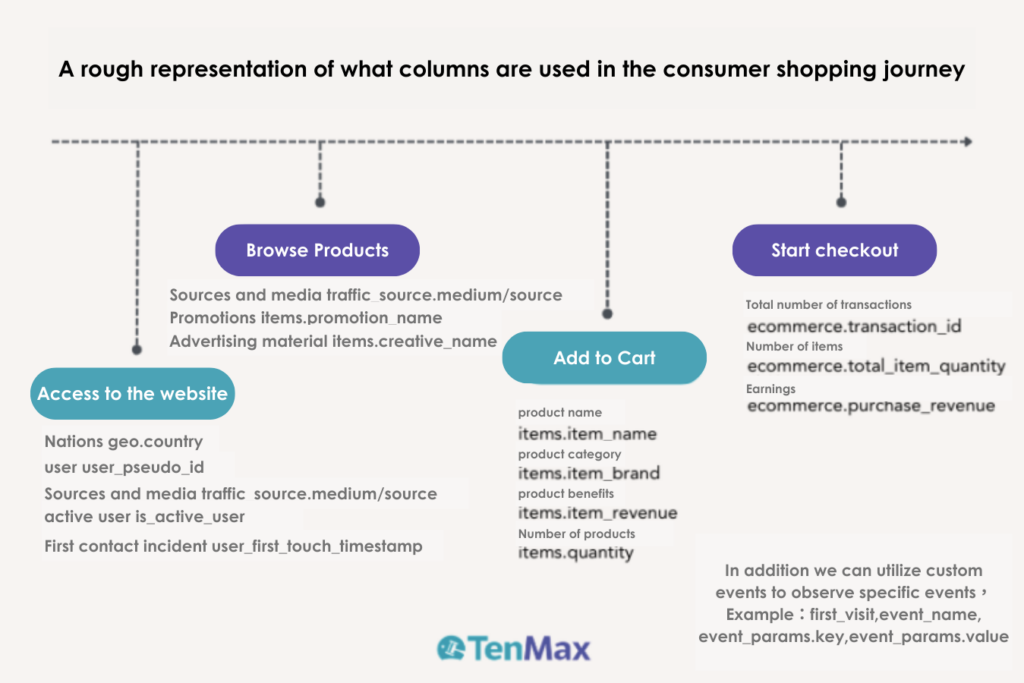
1. Entering the Website:
Understanding where consumers come from and how they navigate to the e-commerce website can be achieved through the application of the following data fields. This allows for a deeper understanding of the process by which consumers enter the website.
- Country Source (geo.country): This field provides information about the consumer’s country, allowing us to differentiate users from different regions.
- User ID (user_pseudo_id): This is an anonymous identifier for a user, aiding in tracking specific user activities.
- Source and Medium (traffic_source.medium/source): These two fields explain through which source/medium consumers entered the website, such as organic search, social media, or advertising.
- Active User (is_active_user): This field indicates whether the consumer is active, helping to understand the overall popularity of the website.
- First Touch Time (user_first_touch_timestamp): This is the time when the consumer first interacted with the website, providing a temporal perspective on user behavior.
2 . Browsing Products:
After consumers enter the website, the next stage involves browsing products. This phase assists us in optimizing product pages, promotional activities, and improving user responses to specific advertisements.
- Source and Medium (traffic_source.medium/source): This field, useful not only in the first stage but also in this phase, provides information about how consumers discover specific products.
- Promotional Activities (items.promotion_name): If consumers interact with promotional activities at this stage, it helps us assess the effectiveness of these promotions.
- Ad Creative (items.creative_name): This field provides information about the advertising creative, revealing which ads may be more effective in attracting users.
3 . Adding to Cart:
As consumers begin to add items to the shopping cart, it is crucial to focus on the following key information to optimize the shopping cart experience, predict demand, and improve conversion rates. Understanding the process consumers go through when entering the website is essential.
- Product Name (items.item_name): The name of the product added to the shopping cart.
- Product Brand (items.item_brand): The brand of the product added to the shopping cart.
- Product Revenue (items.item_revenue): The revenue generated by the product, calculated as price * quantity. This is applicable only for purchase events and is measured in the local currency.
- Product Quantity (items.quantity): The quantity of each product added to the shopping cart.
4. Initiating Checkout:
In the final stage, users begin the checkout process. The following information will help us track and optimize the entire consumer journey, thereby enhancing the operational efficiency of the e-commerce website.
- Total Transaction Count (ecommerce.transaction_id): This is a unique identifier for each transaction, aiding in tracking and differentiating between different transactions.
- Total Item Quantity (ecommerce.total_item_quantity): The total quantity of items purchased in each transaction, helping us understand the scale of individual transactions.
- Purchase Revenue (ecommerce.purchase_revenue): The total revenue generated from all transactions, providing a crucial indicator for evaluating performance and ROI.
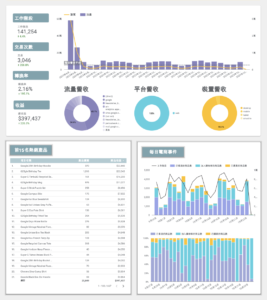
Overall E-commerce Situation:
When a business owner wants to understand the overall e-commerce situation, the following raw data fields will be applied to the indicators in GA4 reports.
1 . Session Number (ga_session_number):
Evaluates the interaction status of consumers on the e-commerce website.
2 . Transaction Count (ecommerce.transaction_id):
Tracks the number of successful transactions.
3 . Conversion Rate (ecommerce.transaction_id / ga_session_number):
Measures the ratio of transactions completed by consumers in a session, quantifying the website’s conversion efficiency.
4 .Revenue (ecommerce.purchase_revenue):
Total revenue for each transaction, a key indicator for measuring website revenue.
5 .Revenue by Traffic, Platform, and Device:
- Traffic (ga_session_number):Analyzes the impact of different traffic sources on the overall performance of the website.
- Platform (platform): Identifies the platform consumers are using.
- Device (device.category):Understands the category of devices consumers are using.
- Revenue (ecommerce.purchase_revenue):Studies the contribution of different traffic sources, platforms, and devices to revenue.
- Top 15 Best-Selling Products:
- Item Name (items.item_name): Identifies the names of best-selling products, providing direction for inventory management and marketing strategies.
- Product Purchase Count (ecommerce.total_item_quantity):The purchase count for each product, an important indicator of product popularity.
- Product Revenue (ecommerce.purchase_revenue):The overall revenue for each product, evaluating the economic value of the products.
- Daily E-commerce Events:
- View to Add to Cart Ratio (add_to_cart / page_view excluding home):Measures the conversion efficiency of users from browsing to adding items to the cart.
- Checkout to Purchase Ratio (ecommerce.transaction_id / add_to_cart):Indicates the conversion rate from users adding items to the cart to ultimately completing a purchase.
- Add to Cart to Purchase Ratio (ecommerce.transaction_id / add_to_cart):Represents the conversion rate of users who, after adding items to the cart, ultimately complete the purchase.
- Purchase to Checkout Ratio (ecommerce.transaction_id / checkout):Quantifies the conversion efficiency of successfully making a purchase after the checkout process.
How to effectively use GA4 raw data on the brand’s official website?
And on the brand’s official website, how should GA4 raw data be utilized? We will break it down into three sections: Traffic Development Analysis, Consumer Analysis, and Active Users, sharing applications for various types of fields with you.
1 . Traffic Development:
Understanding where the overall website traffic comes from allows you to channel resources into the right avenues, yielding more consumers with less effort. Therefore, traffic development is particularly crucial.
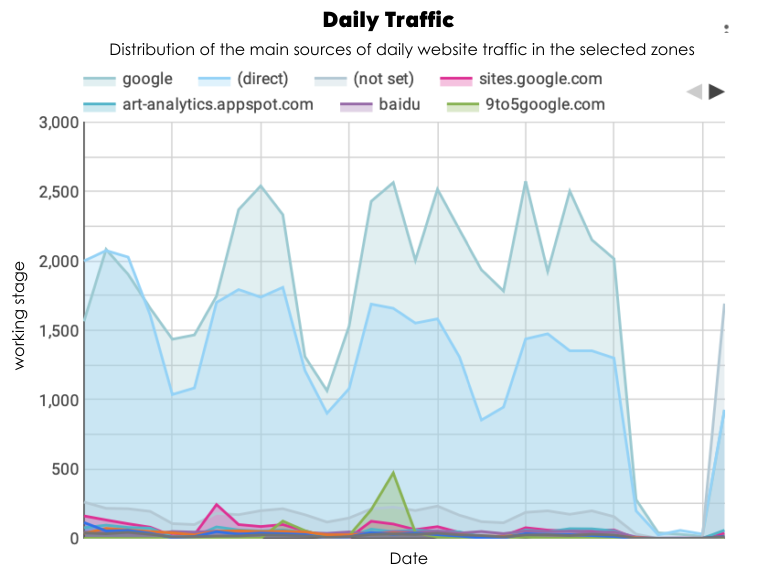
For example, if you want to know the daily proportion of traffic sources and how it fluctuates, you can calculate the percentage by utilizing parameters such as the traffic source (traffic_source.source) and session number (ga_session_number). This information can be used to assess the effectiveness of advertisements on a specific website and other related applications.
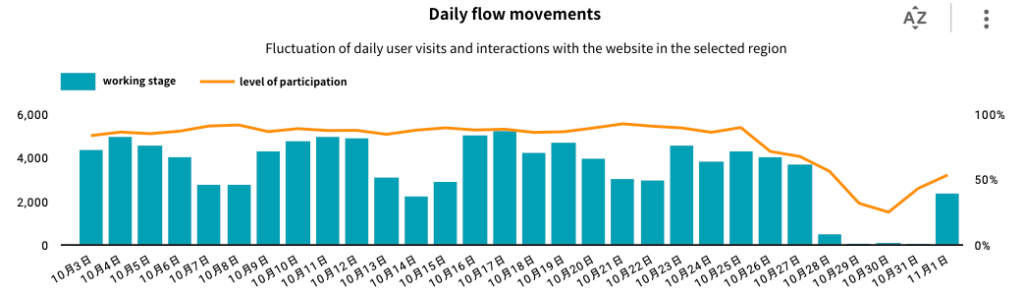
If you want to understand the daily fluctuations in traffic and the changes in user engagement, you can use the session number (ga_session_number) to determine the daily variations in traffic. Additionally, user engagement can be calculated using the engagement metrics (ga_session_engaged) divided by the session number (ga_session_number). This calculation allows you to understand the level of consumer involvement on the website. It can be complemented with promotional activities to observe consumer dwell time and engagement on the website.
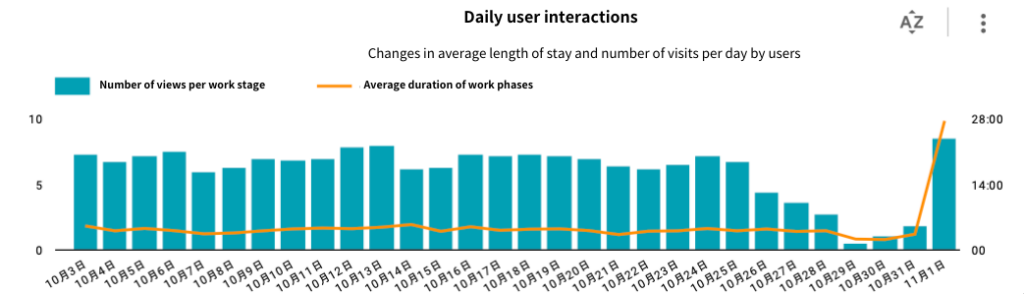
Similarly, you can use metrics such as Views per session (page_view / session_id) and Average session duration (sum(session_length_in_seconds) / ga_session_number or engagement_time_msec) to understand consumer browsing behavior on the website.
2 . Consumer Analysis:
After analyzing the broad aspects of traffic development, the next step is to observe the composition and differences among consumers. By understanding a clearer profile of consumers, we can convey information more precisely to them. We can analyze consumers through the following dimensions:
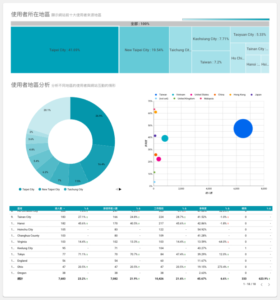
- Region:
Analyzing the geographical regions of consumers can be done using the following parameters: Region (geo.region), Total Users (user_pseudo_id), New Users (first_visit), and Engagement Rate (ga_session_engaged / ga_session_number).
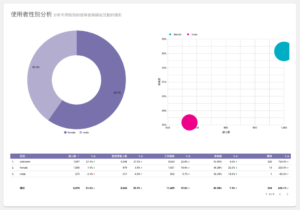
- Gender:
Consumer gender can be analyzed through the following parameters: total user user_pseudo_id, new user first_visit, session ga_session_number, engagement rate ga_session_engaged / ga_session_number. It is important to note that due to privacy concerns, gender data cannot be viewed when integrating with BigQuery; you need to use GA4 to access gender dimensions.
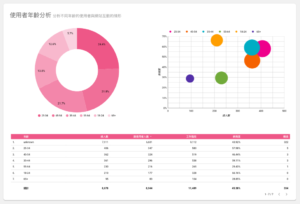
- AGE:
Consumer age can be analyzed through the following parameters: total user user_pseudo_id, new user first_visit, session ga_session_number, engagement rate ga_session_engaged / ga_session_number. Similarly, due to privacy concerns, age data cannot be viewed when integrating with BigQuery; you need to use GA4 to access age dimensions.
3 . Active Users:
After analyzing consumer segments, the next step is to identify who are the valuable and active consumers. For instance, we can analyze what devices these active users are using, compare their engagement levels on different devices, and utilize the following parameters:
Device Category: device.category Active Users: user_pseudo_id, session_engaged, engagement_time_msec
The indicators of activity can be measured through:
Engagement Rate: ga_session_engaged / ga_session_number, and active users identified by user_pseudo_id, session_engaged, and engagement_time_msec.
To improve performance, it is crucial to consistently monitor GA4 to ensure it continues to operate correctly and make meaningful optimization decisions based on data. However, if you find yourself unable to understand anything or are unsure about what to do in GA4, what should you do?
The TenMax GA4 Import Solution Team is your best choice. We provide the most professional services, covering everything from setting up GA4 custom events to configuring BigQuery and applying data to Looker Studio. We help make your store more competitive. Contact the TenMax professional import team now, and we’ll provide you with a free GA4 health check service!
This article is authorized by TenMax
Author:Makayla
Read more:
GA4 升级检查|3 种方式检查 GA4 导入完整度